
Dr Jan Van der Meer kindly gave us two E.Coli strains, the arsenic biosensor (1598) and one expressing eGFP constitutively (2676). So we could do some tests with our device.

Arsenic-eGFP strain expression map

eGFP-expressing strain expression map
We were surprised to see that the bacteria expressed eGFP and not wild-type GFP, so we had to reconsider the excitation wavelength (488 nm instead of 395 nm).
First, we put our bacteria in a kanamycin-LB solution to grow overnight, since we only wanted the kanamycin resistant ones to survive. To get a 50mg/ml solution, we diluted 0.5g of solid kanamycin into 0.5ml of ddH2O (double distilled water).
The following day, we diluted our colonies and put them on agar-LB-Kanamycin plates to be able to count them later.
We also made a glycerol stock to be able to store the bacteria at -80°C during a longer time. For that, we used:
- 0.5 ml of 40% gylcerol (it will prevent the water to expand while freezed, and preserve the bacteria)
- 0.5 ml of our sample bacteria (As & eGFP-only E.Coli)
We poured the glycerol in the vial first to avoid contamination, then gently vortex the solution and stored it on dry ice.
In parallel to the plating and glycerol stock making, we made some tests with our prototype with 6 dilutions of eGFP–bacteria (the data are still in processing). In addition, we did some control measures with a fluorometer.
We expected to see a diminution in fluorescence according to the augmentation of the dilution of the sample, as well as peaks at excitation and emission wavelength of 488 nm and 509 nm (eGPF).
The results below show a diminution of fluorescence in function of dilution following a linear behaviour (Fig 1) as expected.

Fig 1 : Fluorescence in function of the dilution for excitation at 488nm and emission at 525nm (logarithmic scale)
- For the excitation (Fig 2) and emission (Fig 3) wavelengths, we can see that the maximum values are around 488 nm and 509 nm as expected (detection of eGFP). The greater dilutions are not visible, as they have each time a 10 times smaller signal.
-

Fig 2 : Excitation scan from 450 to 490 nm, emission fixed at 525 nm

Fig 3 : Emission scan from 490 to 560 nm, excitation fixed at 488 nm


These measures show that the bacteria is indeed expressing eGFP and that the fluorescence is dependent of the concentration.
Unfortunately, we had some problems with the measures for the prototype testing, so we will make some more in another wet-lab session.
For the bacterial counting, we used ImageJ, But the pictures we took were lacking contrast, so we draw black dots on the colonies. Then, we set the threshold (Image/Adjust/Threshold) so only the dots remain visible and let the programm count them (Analyze/Analyze particles). Do not forget to convert the image to 8-bit (Image/Type), so that the colors do not interfere with the processing.
-
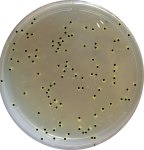
- Bacterial count with ImageJ
-
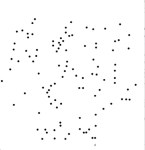
- Picture after threshold treatment
The program counted 106 colonies.
